Pretty graphs!
by BenV on Sep.24, 2009, under Boring, Software
Everyone loves them (except for idiots of course), pretty graphs that show fancy lines and stuff. Especially stuff.
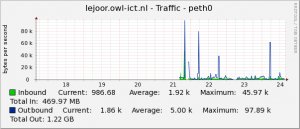
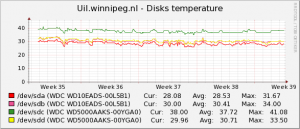
For instance stuff like this:
Why make these graphs? Because you can. Because they can show you gradual changes that you normally wouldn’t notice because the change per day is only very little. Because they’re fancy. Because they can give an indication on how hot stuff runs. Because they can kill your mother while you sleep. Because they got all the legendary items that you’ll never have. Tons of reasons.
But mainly because they’re pretty 🙂
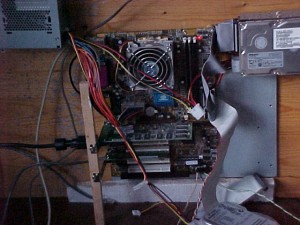
(Thanks to the waybackmachine for this foto on the left, I had lost it!)
Years ago when my fileserver was hanging on a wall in the barn (who needs cases anyway) where it would sometimes literally freeze, and sometimes be a whopping 30-40 degrees I decided it would be interesting to graph these temperatures etc. I dove into lm_sensors and managed to get temperature information from my motherboard sensors. But where do you stick them?
These days there are plenty of options, but back the option that I liked best was write some scripts that hack together a bunch of rrdtool commands and run those from cron every 5 minutes. For those who don’t know rrdtool, RRDtool is a neat tool that creates round robin databases that you can feed data into based on an interval of your choosing. After feeding it information you can pull graphs out of it as shown in the top images with a ton of options.
Hacking these scripts together was fun the first time, but after a while it gets tedious. Especially when you lose the scripts to a harddisk crash or have to rewrite them because of different output etc. So what some people do is use a tool that takes data from a source (still a script in most cases, but very tiny scripts) and stashes it into a rrdtool database for them. Some of them even generate the graphs for you with a nice little (web)interface.
So after losing the entire fileserver after moving (guess it didn’t like being removed from the barn) I checked out several tools.
- MRTG is well known for making those router datatraffic graphs. People (ab)use it for generating tons of other graphs as well these days. Nice and simple if you want to generate those data traffic graphs, but if you want a tool that is a little more versatile you probably do not want MRTG. It’s cool though, and made by the same author as RRDtool.
- Munin is a bigger project aimed at monitoring pretty much everything. There’s a ton of plugins for this beast that do just that. However, when playing around with it I found out that it also sucked a ton of CPU out of my machine while generating the graphs every time. It has a CGI mode where it’s supposed to only generate those when requested, but I couldn’t get it working (dead image links and everything). Cute toy, but it’s still very rough around the edges. Too much for my liking, so I ditched it after toying with it for a few months.
- Then we have Cacti, the tool I still use today. You can read more about it below.
- Of course there are also a ton of commercial solutions for this, but I don’t like commercial stuff. I’ve heard a few good things about ZenOSS though… but I can’t get through their commercial site. No info, only marketing bullshit. So no go. (and no sale)
Cacti
Right now I’m back to Cacti again for the pretty graphs solution. Why Cacti?
- Relatively nice web interface to configure and view your data sources, devices to monitor, and of course your graphs
- Comes with a bunch of good default graphs and tools. Templates are good.
- Doesn’t suck the life out of my CPU, although obviously all monitoring solutions waste a bunch of CPU. One reason is that it generates graphs on demand, not every 5 minutes.
- Easy installation (Apache + PHP + MySQL), doesn’t require much on other devices that you want to monitor. (SNMP is enough most of the times)
What sucks about Cacti?
- It can be a bitch to get a graph working. One of the reasons I switched to other products was that I couldn’t get Cacti to work for some very simple graphs, but I couldn’t figure out why it wouldn’t work.
- Interface could use a redesign. It works, but the steps to generate a graph are confusing, there are several ways to do it and half of them don’t work as you’d expect. Maybe some wizards could fix this though.
- Development isn’t dead, but it sure as hell isn’t going anywhere soon. When I quit using Cacti it pretty much looked and worked the same as it does now. That’s been 3 years I think.
Installing Cacti is something you’ll manage yourself. Just trash it in the webdir, point your browser at it and walk through the installation steps. Easy enough. Just make sure your server has net-snmp installed. Now for adding some basic graphs.
The easiest way of generating graphs is by getting your data through SNMP. Most (not too cheap) routers and managed switches respond to it, and on all *nix systems you can get it running. Configuring SNMP can be a little more annoying though, since it’s one of those products that are really confusing to start with. Either walk through snmpconf -g basic_setup to generate your snmpd.conf, or take mine for some defaults. Be sure to close SNMP from outside your network of trust (the internet), they don’t need that access. SNMP is one of those protocols that can’t convince me of being secure. There are 3 versions of it, version 1 basically has no security, version 2 has no security with added layers of obscurity and with version 3 it becomes impossible to operate while having user/password/network combinations of “security”. So I don’t trust it, but that’s what a firewall is for. Since I don’t trust it anyway, I have the configuration pretty much open for reading anything by anyone as long as you can reach it. (I’m sure the SNMP experts disagree with my vision. You can link your tutorials on how to set it up below).
[Download not found]
Oh yeah, another beauty: smnpd and its configuration depend on how it was compiled. So sometimes you do get disk stats, sometimes you don’t. Sensor statistics usually isn’t included, but if you recompile net-snmp and add --with-mib-modules="ucd-snmp/lmSensors" (and your other modules!!!) you at least have a chance of getting it working.
If you want to test or check the information that your snmp daemon returns, try snmpwalk -v1 -c public $YOURHOSTNAME.
Now that we’ve got that out of the way, let’s walk through the steps of creating fancy graphs.
- On your device that you want to make graphs of, install snmpd and put the snmpd.conf in /etc/snmp. Oh, and start snmpd.
- In the webinterface (as admin), go to Console -> Devices and click add in the upper right corner
- Fill out information that’s obvious (hostname, description) and pick ucd/net SNMP host for template. I always pick SNMP version 2 (since 3 is so much more hassle to setup) and hit create. It should return Save Successful.If it mentions SNMP error then your snmp daemon could not be reached or returned bad information. Fix it! For pokemon os check out /etc/default/snmpd where they run it only on 127.0.0.1 by default. Either remove it or add your internal network IP address there. If you think it’s fixed OR want some debug info, scroll down to Associated Data Queries and click verbose query (any one will do). Once SNMP information doesn’t moan about errors anymore but gives you some decent info, it’s good.
- Click Create Graphs for this Host. You should now get a selection screen where you can check boxes of things you want graphs from. If because of your constant failing the SNMP queries failed to get results in the previous step and therefore show you no options in the Data Query boxes, you might have to click the green circle in the blue bar to reload that query. If it’s still empty your snmpd probably doesn’t supply that information.
- Enable the checkboxes for lines that sound like they would make an interesting graph. CPU, Memory, and Load usually work and if you have interface statistics pick one that has a reasonable IP address. Hit Create when you’ve enabled all checkboxes that sound good.
- This is enough to let Cacti generate graphs, but you also want to be able to view those graphs. Go to Graph Trees in the left menu and click Default Tree on the rigth pane. Click Add, then for Tree Item Type take Host. Select your newly created device and hit Create. Now go fix yourself a cup of coffee while the graphs are being manufactured.
“But my graphs are empty! Images missing! My head exploding!”
Yeah, I know that feeling. First of all: WAIT! First the graphs have to be generated and collect some data before something appears. This will take a few cycles, and a cycle is 5 minutes. In other words: go fish for half an hour, play a game, do a rain dance. Now there should be pretty graphs!
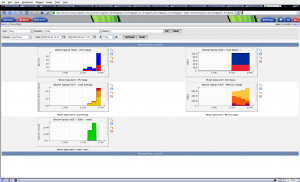
Like this:
Now go add your other devices!
If you feel like trying out some more advanced stuff, check out some of the scripts/templates on the cacti forums . For instance the Disk IO graphs I can be made with this snmpdiskio package.
Well, enough for now, thanks for reading!


